What USAspending.gov Can’t Show About ICE’s Detention Spending
Most people held by Immigration and Customs Enforcement (ICE) are in state and local facilities that ICE uses through intergovernmental service agreements (IGSAs). In July 2026, these facilities held 57% of ICE's detainees.
Federal auditors have warned about the fiscal risks of IGSAs since 2009. The Homeland Security inspector general found that ICE lacked adequate standards for the agreements and risked overpaying under them. It also found that from 2015 to 2018, ICE penalized facilities for failing detention standards on “only two occasions” despite thousands of documented violations of the agency’s own detention standards. GAO found that ICE had spent “millions of dollars a month on unused detention beds.” ICE values IGSAs for their flexibility: it can enter into them without competition and change their terms after they're signed.
Yet the public record of federal spending shows almost none of this. USAspending.gov is meant to show who receives federal money. From February 2025 through July 2026, ICE obligated $5.91 billion to operate and maintain detention facilities, and its award records account for $3.14 billion of that. Ten private detention contractors received 98%. Awards made directly to state and local governments show a net reduction of $28,520.
Only two awards name a facility that ICE lists solely under an IGSA. They total $17.5 million, and both fall under a non-competitive contract that replaced two New Mexico counties’ IGSAs in April 2026. No award record identifies the spending under the counties’ IGSAs.
This post shows where ICE's IGSA payments most likely sit in the public data. The same gap appears in ICE's construction spending: in a report for Co-Equal, I found that public award records identified the recipients of only 7% of its $5.4 billion from its construction account. This analysis shows how tracing its detention spending from its operations account will require additional sources beyond USAspending.gov.
Why IGSA Payments Are Hard To Find
IGSAs do not clearly fit the kinds of spending for which federal law requires a public record of who was paid. The law that created USAspending.gov requires the site to show the recipient and amount of each “federal award,” which it defines to include “grants, subgrants, loans, awards, cooperative agreements, and other forms of financial assistance," as well as "contracts, subcontracts, purchase orders, task orders, and delivery orders.”1 However, in 2018, the Department of Homeland Security's Inspector General (DHS OIG) found that IGSAs “are not grants,” and that ICE “has not formally defined IGSAs as cooperative agreements or procurement contracts” or followed the federal rules that govern these awards.2
Instead, ICE has asserted that a 1996 law exempts IGSAs from these rules. The Illegal Immigration Reform and Immigrant Responsibility Act allowed the Attorney General to pay for the “housing, care, and security of persons detained” by immigration authorities “under an agreement with a State or political subdivision of a State.”3 The law does not say what kind of agreement that is or which federal contracting rules apply. ICE told the inspector general it considers IGSAs “exempt from the Competition in Contracting Act and FAR [Federal Acquisition Regulations],” though still subject to appropriations law and federal cost principles, and its guidance describes them as functioning like “a form of fixed-price, indefinite quantity, indefinite delivery type contract.”4 The inspector general concluded that ICE had “no assurance” its detention agreements served “the best interest of the Federal Government, taxpayers, or detainees."5
What the Data Show
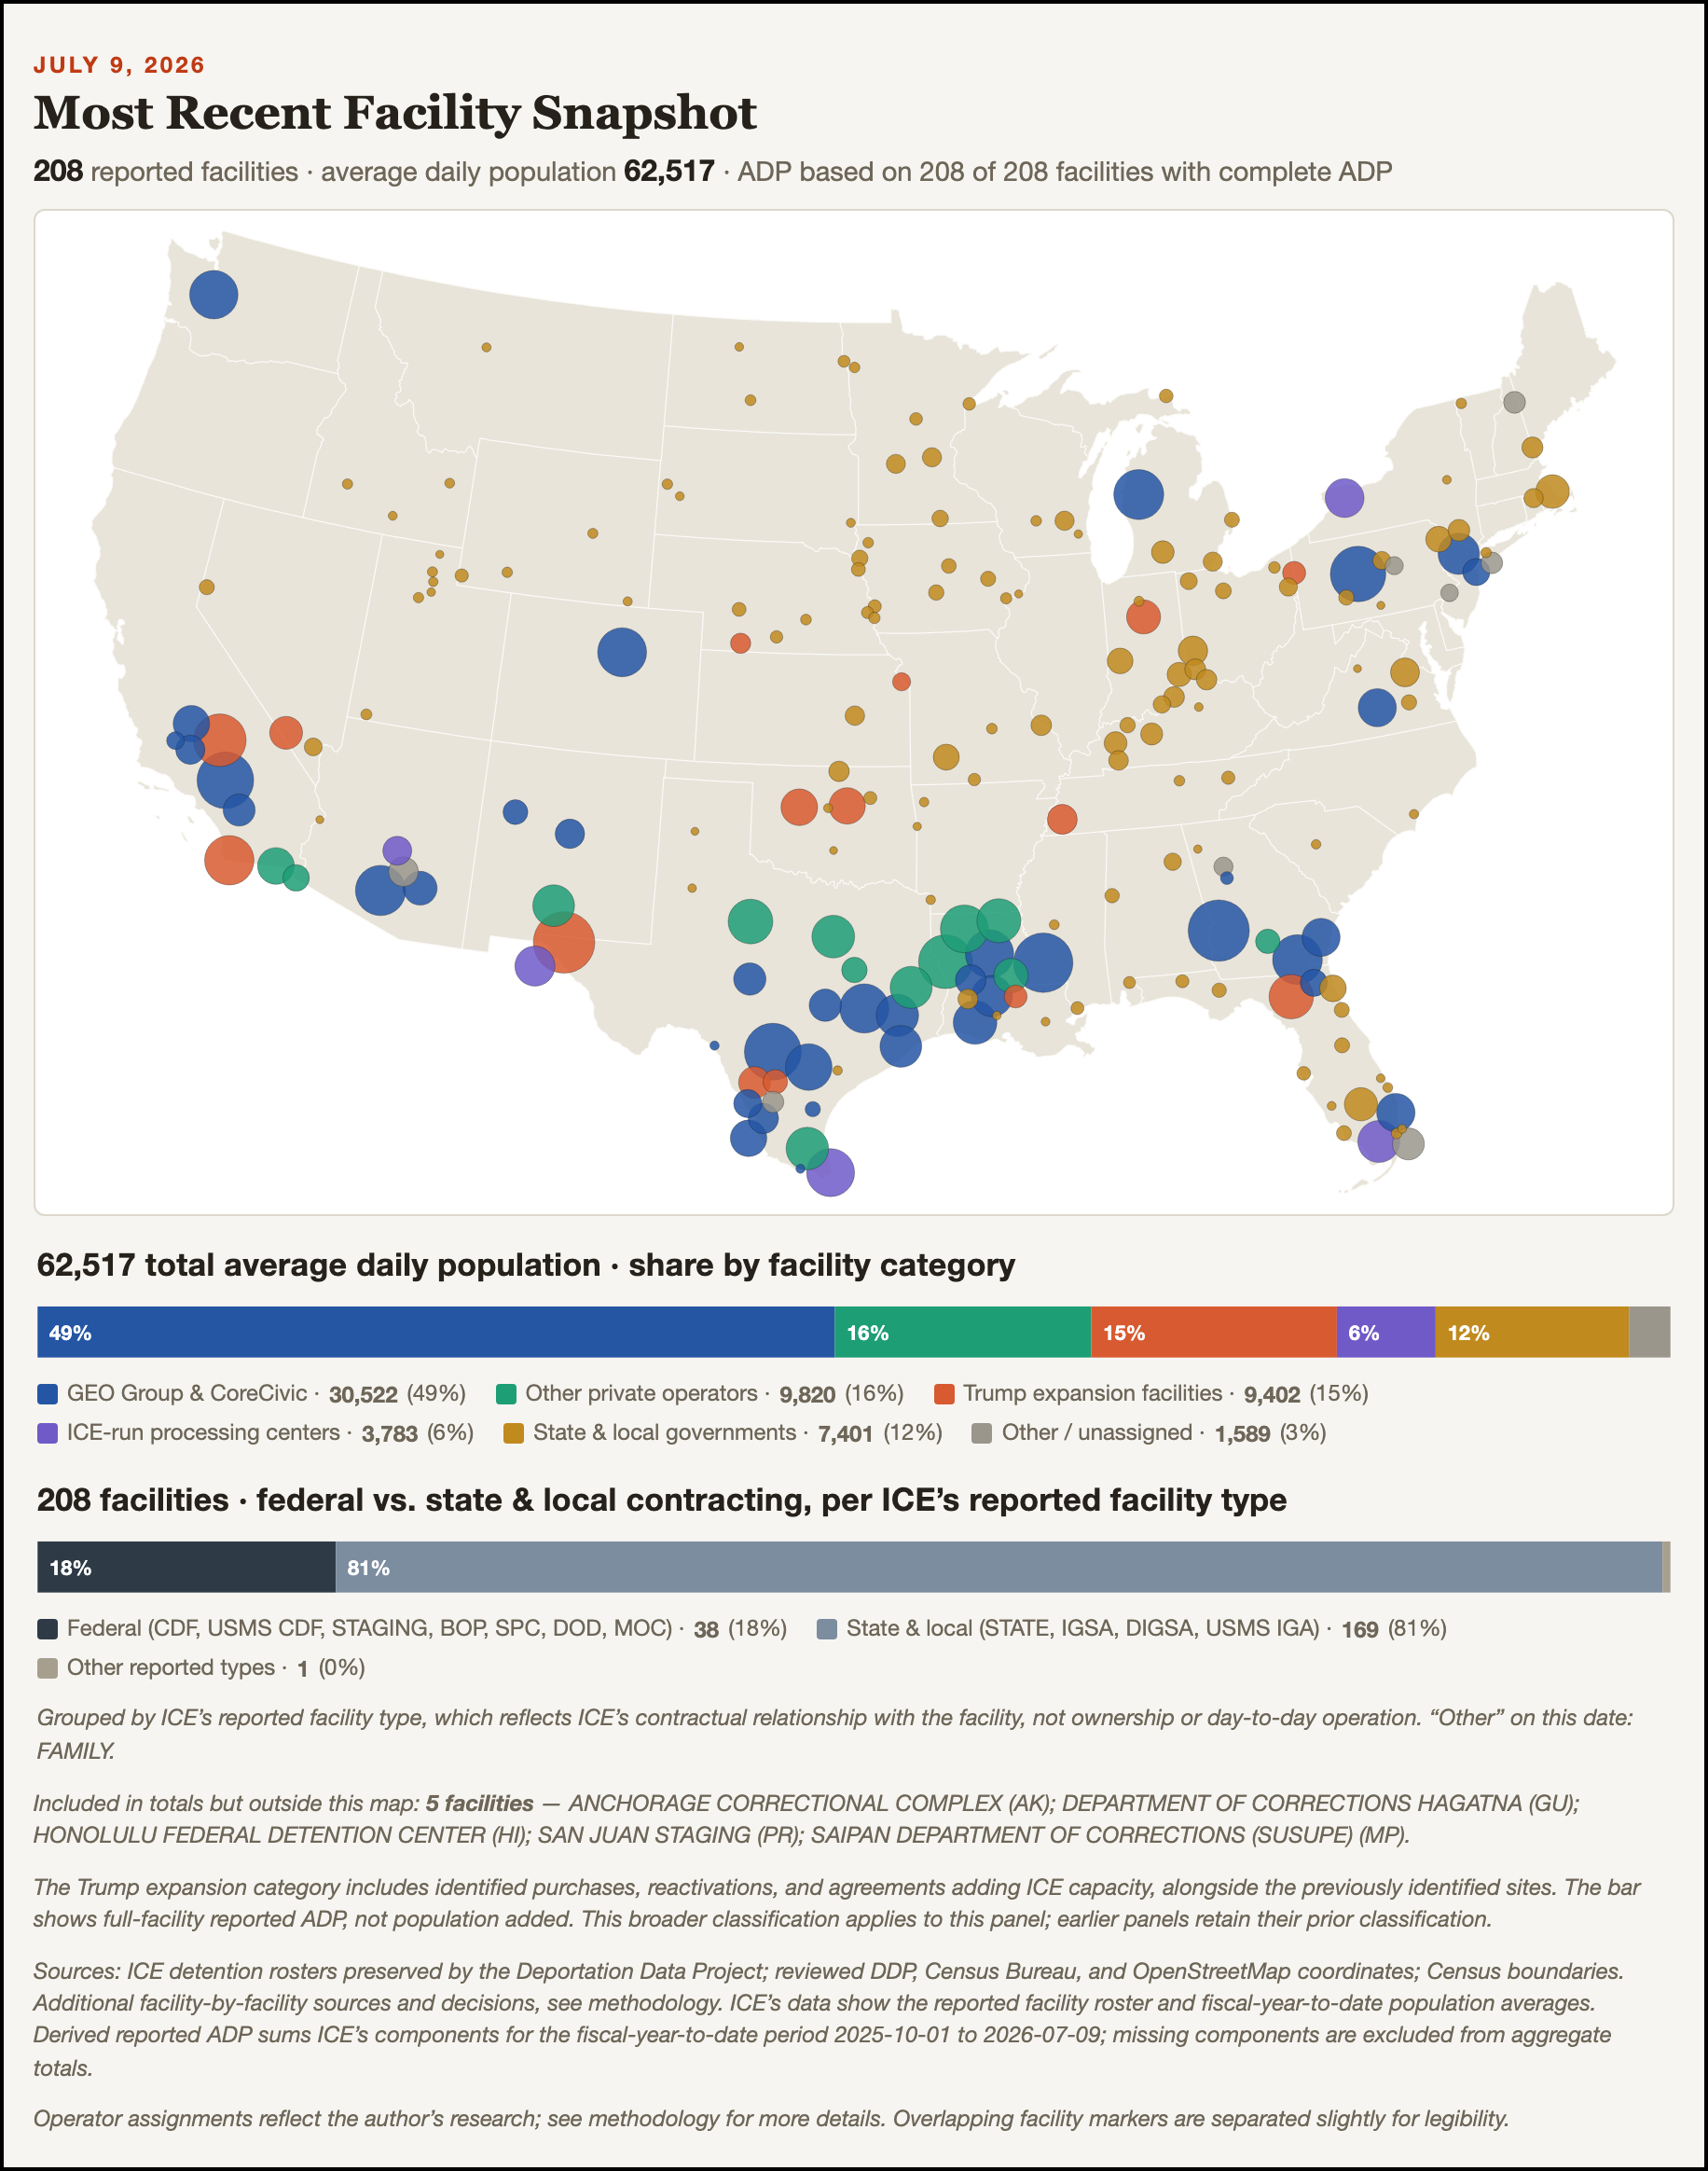
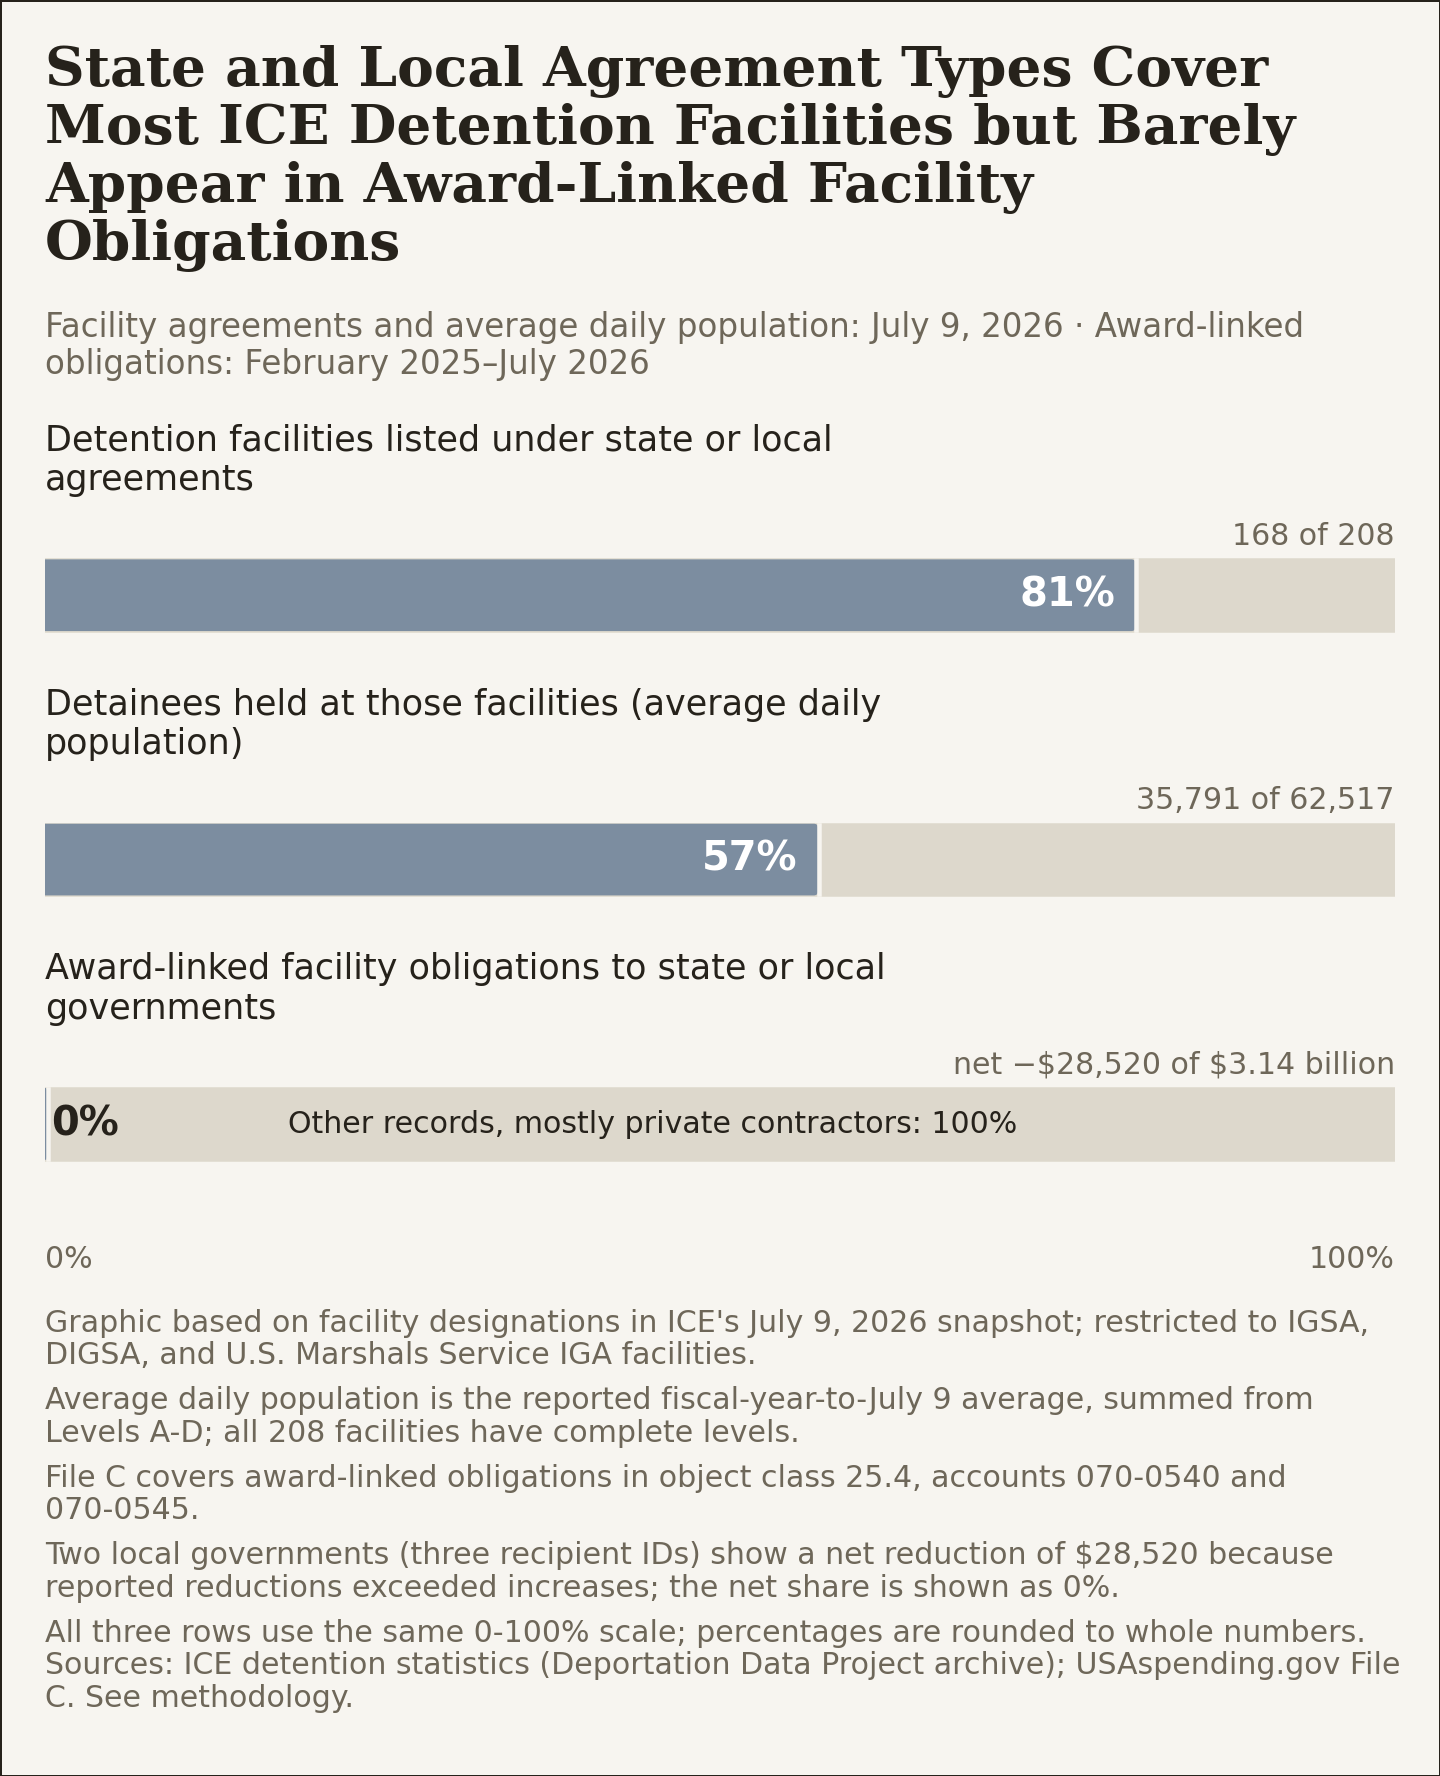
ICE's own data show how much its detention network depends on IGSA facilities. In its July 2026 facility list, 168 of the 208 facilities holding ICE detainees (81%) operated under agreements with state or local governments. Of these, 104 facilities were local jails and other facilities that ICE uses through agreements held by the U.S. Marshals Service, 38 operated under ICE's own IGSAs, and 26 were IGSA facilities dedicated to ICE detainees. Together, these facilities held 57% of ICE's average daily detained population, as shown below.6
Despite ICE’s reliance on IGSA facilities, little is known about how ICE discloses the spending tied to these agreements. ICE reports its spending on USAspending.gov in two datasets.7 The first does not identify who received ICE funding, but shows ICE’s total obligations and spending by appropriations account and “object class,” a broad category of what the agency buys. These totals include ICE’s own payroll and employee benefits as well as its payments to state and local governments, private entities, and other federal agencies. The second dataset contains records for individual spending awards, which name the funding’s recipient. Any obligation ICE does not tie to a spending award appears only in the account totals.
If ICE reported its IGSA payments to spending awards, then the counties, cities, and states that are counterparties on the IGSAs would appear among the recipients. They almost never do. From February 2025 through July 2026, ICE tied $3.14 billion in obligations for “operating and maintaining facilities” to spending awards with 74 named recipients. Ten private detention contractors received 98% of this funding.8 Only three recipients, representing two local governments, are state and local governments and their awards show a net reduction of $28,520.9
Why are the counties and cities missing? One possible explanation is that the award records name the private companies that run many of the IGSA facilities, not the governments that signed the IGSAs. If so, those payments would be hard to find because the same companies also run facilities under contracts directly with ICE. In July 2026, facilities run by the two largest contractors – GEO Group and CoreCivic – held 58% of ICE detainees. About half of those detainees were in facilities ICE uses under agreements with state and local governments, and most of the rest were in facilities ICE contracts for directly. A payment to GEO or CoreCivic could therefore pay for either kind of facility, and the award record may not say which.
To test that explanation, I searched the descriptions attached to ICE’s award records for the name of every facility in ICE’s detention statistics from January 2025 through July 2026. These descriptions are open-ended and are not required to list a facility, but some do.10
The results split sharply by type of facility. Award descriptions name 21 of the 49 facilities listed as federal or as one of ICE’s “service processing centers” or other “contract” facilities. Those awards account for $2.23 billion, or 71% of the $3.14 billion total. But the descriptions only mention five of the 224 facilities listed as IGSA facilities. These spending awards totaled $96 million, just 3% of the total. Most of these obligations went to facilities that ICE also listed as contract facilities. Only two awards name a facility that ICE listed solely as an IGSA, totaling $17.5 million. Because descriptions need not name a facility, the search can miss payments. But it finds almost no trace of the state and local facilities that hold most of ICE's detainees.
When the IGSAs Ended, the Spending Appeared
The two awards behind that $17.5 million are the clearest evidence that ICE's payments under IGSAs are missing from the award records. ICE held detainees at both facilities for years under agreements with the counties, which paid CoreCivic to run them: Cibola County's IGSA dates to October 2016 and Torrance County's to May 2019.11 These agreements show that ICE approved payment increases, including higher payment rates approved in 2025 and 2026, retroactive to earlier months. Yet in the award data since October 2024 until the agreements ended, no award record identifies either agreement or either county as a recipient.12
In February 2026, New Mexico enacted the Immigrant Safety Act, which bars local governments from entering into or extending agreements to hold people for civil immigration violations, including IGSAs, and required local governments to terminate their IGSAs.13 In March, ICE announced it would issue a non-competitive contract with CoreCivic for both facilities.14 On April 30, the IGSAs expired and ICE awarded CoreCivic. The new contract’s spending immediately appeared in the award records: two task orders with $17.5 million obligated to operate the facilities through July.15
If ICE is paying other IGSA facilities the same way, much of its spending at the state and local jails that hold most of its detainees may be missing from those records as well.
Where the Undisclosed Spending Sits
From February 2025 through July 2026, ICE obligated $4.8 billion from its operations account for facilities, services, transportation and equipment without tying it to any award, as shown below. USAspending.gov shows how much ICE committed of this funding, but not who received it.
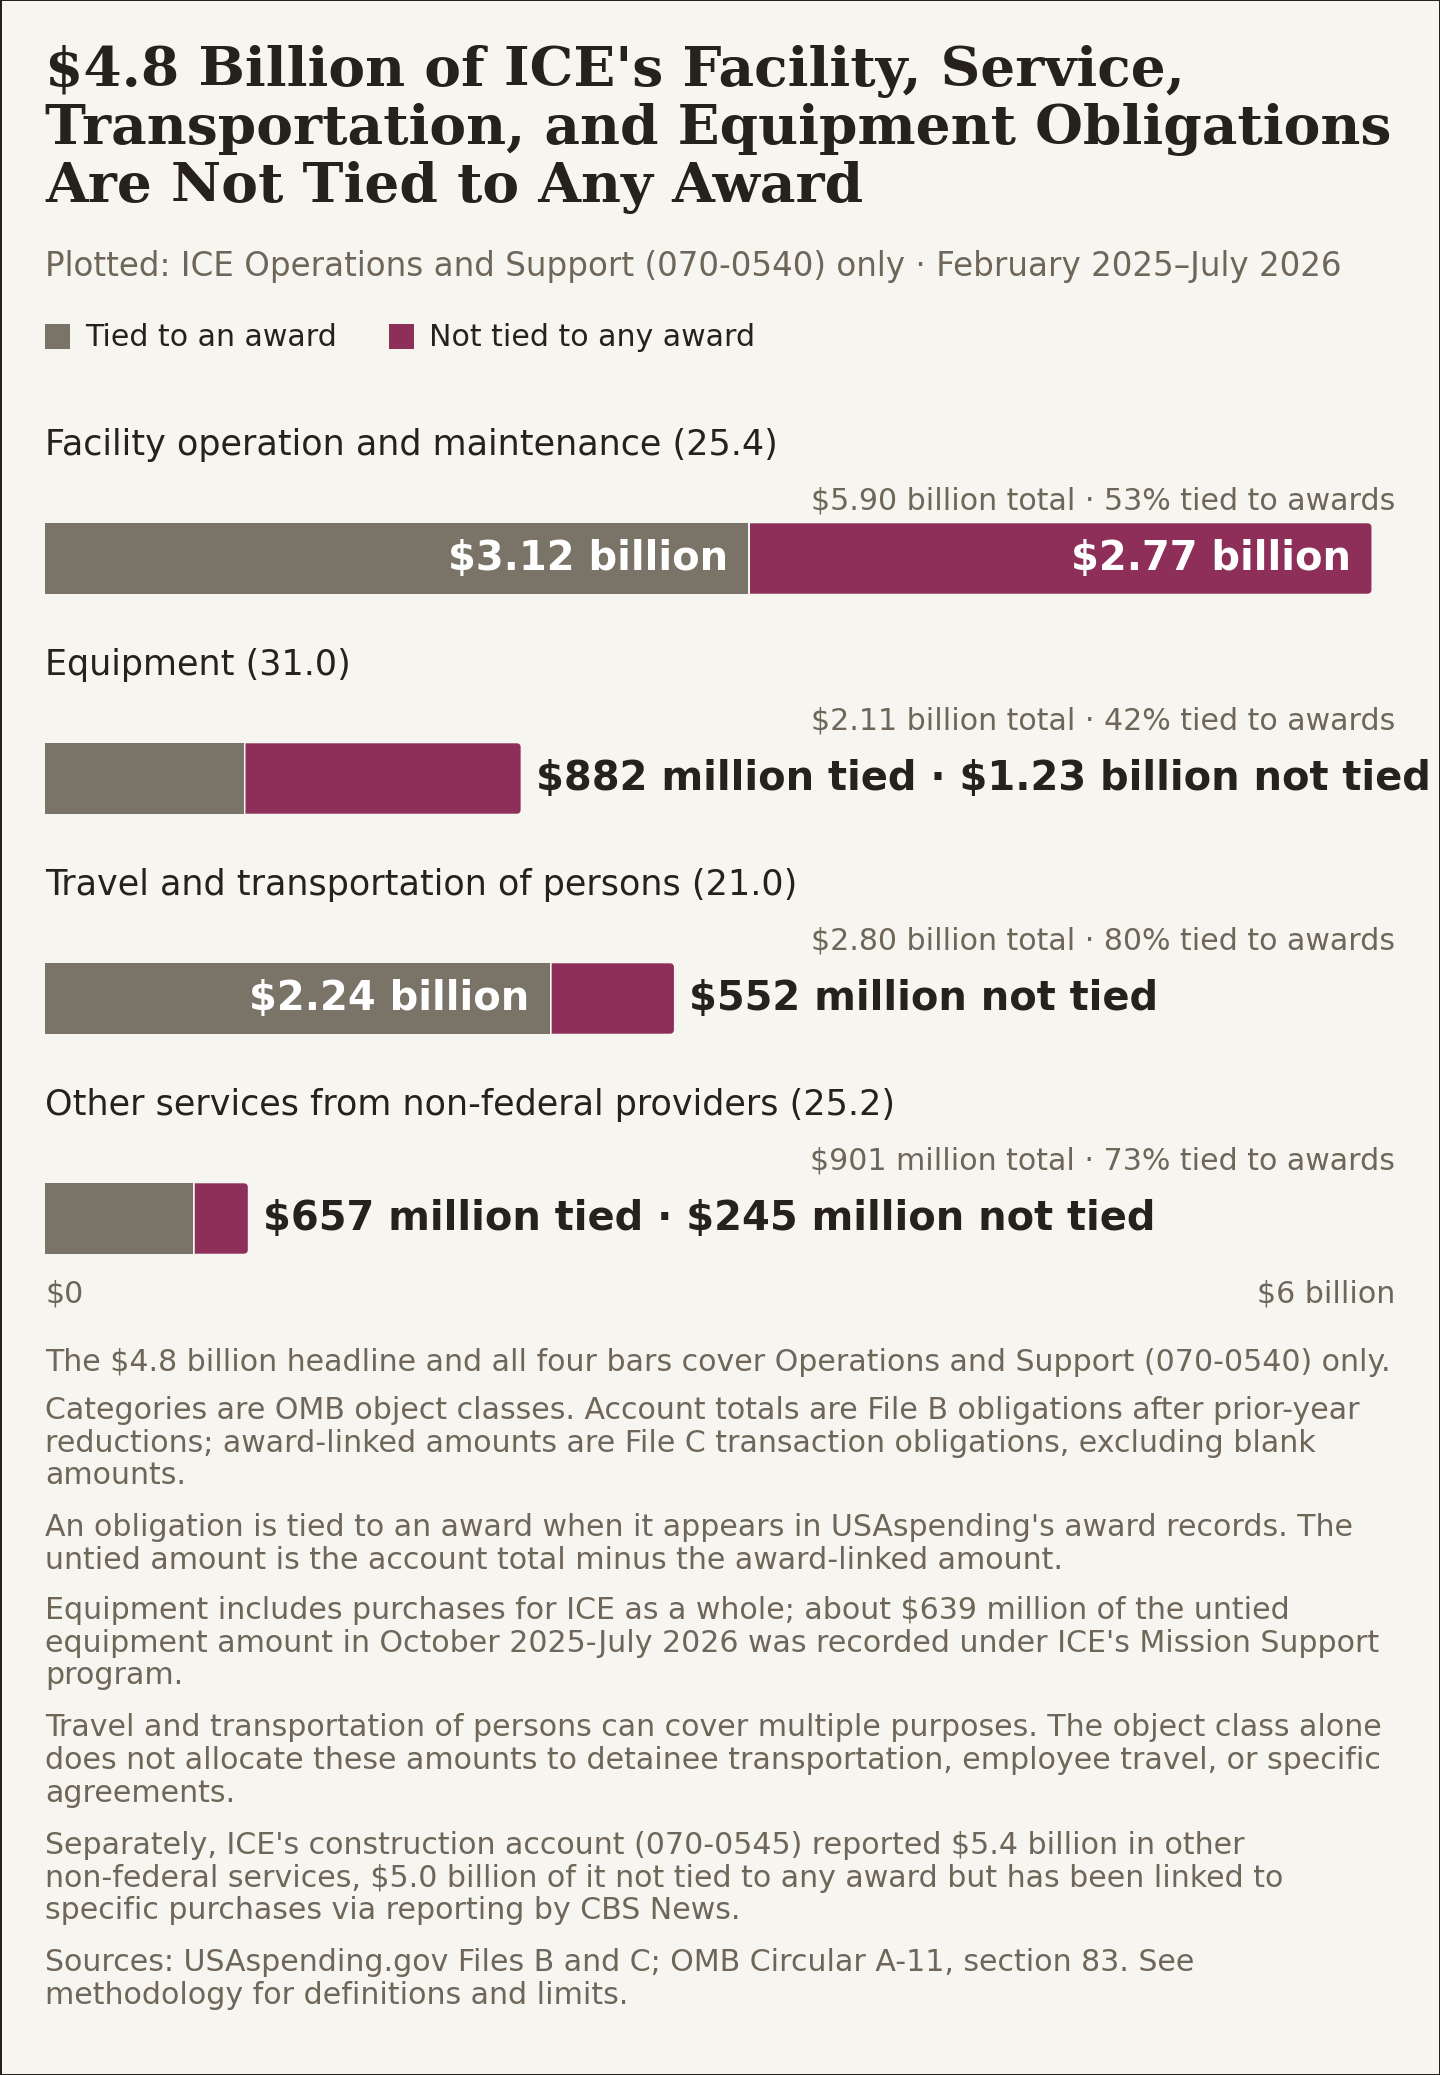
This analysis indicates that ICE's payments under IGSAs are most likely in one of two places: in these account-level totals, or in award records that do not identify the facility they pay for. The untied totals also include other spending, however, such as travel by ICE's own employees and payments to other federal agencies.16
The DHS OIG and GAO have been highlighting the fiscal risks of ICE’s IGSAs for nearly two decades, including overpayments, failures to penalize underperforming facilities, and spending “millions of dollars a month on unused detention beds.”17 ICE has defended IGSAs for the flexibility they give it. Responding to the inspector general in 2018, Thomas Homan, then performing the duties of ICE's director, wrote that IGSAs allow ICE “to acquire beds quickly and in remote locations,” that ICE may enter into them “noncompetitively,” and that it is “free to take advantage of the broad flexibilities afforded by its IGSA authority to modify the terms of the original agreement.”18
These risks are magnified by the tens of billions that ICE has at its disposal from the One Big Beautiful Bill Act and Secure America Act. Local reporting shows ICE has increased its IGSA payments. In Muscatine County, Iowa, ICE raised the cap on its payments to the county jail by 75% under an agreement that bars “public disclosures.”19 Payments to another Iowa County have more than doubled.20 In Oklahoma, ICE's monthly payments under the state corrections department's agreement for the Diamondback facility grew from $2.0 million in October 2025, when it held no detainees, to $8.3 million in March 2026.21
This analysis set out to use federal data to show how ICE is using IGSAs. It shows where that spending most likely sits and its potential scale. But federal data alone cannot show the full scope of ICE’s detention spending. Assembling a full picture will require additional public attention and scrutiny of ICE’s IGSAs.
Methodology
This analysis is provisional and reflects data downloaded in September 2026. Please contact me with any corrections here.
I did this analysis with two AI coding assistants, Anthropic's Claude and OpenAI's Codex. Codex wrote and ran most of the code that downloads, processes, and checks the data. Claude searched for and checked source documents, tested the figures against those sources, and suggested edits to this post. I directed the work, reviewed the results, and made the final decisions on methods and wording. I am responsible for the analysis and any errors in it. See my GitHub for additional details.
ICE Spending: USAspending.gov Data
Where to find the data: Go to USAspending.gov's Custom Account Data download. Select the Department of Homeland Security and the Treasury Account level, and download two file types:
“Account Breakdown by Program Activity & Object Class” (File B). This data shows obligations by account and object class.
“Account Breakdown by Award” (File C). It reports obligations for individual awards, such as contracts and task orders, and names each recipient.
I downloaded File B for FY2025 period 4 (January) and period 12 (September), and FY2026 period 10 (July). I downloaded File C for FY2025 period 12 and FY2026 period 10. Data was downloaded on September 15, 16 and 23, 2026.
Which records. I kept ICE's two accounts: Operations and Support (070-0540) and Procurement, Construction, and Improvements (070-0545). The main comparison uses object class 25.4, “operation and maintenance of facilities.” OMB defines this class as work “when done by contract with the private sector or another Federal Government account.” This is broader than detention.
Time Period. The analysis covers obligations ICE recorded from February 2025 through July 2026. File B totals accumulate over each fiscal year. For FY2025, I subtracted each account's January 2025 cumulative total from its September 2025 cumulative total. I then added FY2026 totals through July. For File C, I added the transaction_obligated_amount for records reported in the same months. Agencies report October activity with November's, so FY2026 starts with period 2. Neither file's outlay columns are added to obligations.
Main Result. For object class 25.4, File B shows $5.91 billion and File C shows $3.14 billion. The $2.77 billion difference is an accounting gap between the two reports. It is not a count of missing awards or an estimate of IGSA spending.
Recipients
Where to find it. Each File C record carries the recipient's Unique Entity Identifier (UEI). USAspending.gov's recipient profiles, and SAM.gov, show each UEI's name and entity type.
What I did. I grouped the $3.14 billion by UEI. Records naming 74 UEIs account for $3,127,031,939, and records with no recipient account for the other $9,498,809. An organization with two UEIs counts twice. I classified each UEI by the entity information USAspending.gov reports for its awards, retrieved September 23, 2026, not by name alone.
Ten private detention contractors received $3,080,063,270, or 98%. The totals show who received obligations, not what the money bought. Two other detention contractors, LaSalle Corrections and Asset Protection & Security Services, each received a $250 minimum order and are not counted.
State and local governments: three UEIs belonging to two governments. Imperial County's two awards (70CMSD18P00000133 and 70CMSD23P00000069) were reduced by $18,000 and $14,580. Cottage Grove's award (70CDCR25P00000021) carries $4,060. The net is −$28,520. The Denver Health and Hospital Authority, listed by USAspending.gov as both a local government and a hospital, is grouped with health providers. Its only record is a $2,000 reduction.
Detention Facilities: ICE Detention Statistics
Where to find it. ICE posts its detention statistics as spreadsheets on its Detention Management page. The July 9, 2026 figures come from the “Facilities FY26” sheet of the workbook posted July 20, 2026 (FY26_detentionStats07202026.xlsx).
What I counted. “IGSA facilities” means three types ICE reports: IGSA (38 facilities), dedicated IGSA (26) and U.S. Marshals Service intergovernmental agreement (104). That is 168 of 208 facilities, or 81%. The count excludes Baker Correctional Institution, which ICE lists as a state facility, and the Dilley family residential center.
Population is the sum of each facility's average daily population, Levels A–D. These are fiscal-year-to-date averages, not counts on July 9. The 168 facilities held 35,791 of 62,517, or 57%.
ICE's type labels describe how ICE reports a facility. They do not show who runs it or who is paid. For the Marshals Service agreements, some payments may flow through the Marshals Service rather than ICE.
Operators. The GEO Group and CoreCivic figures use the operator attributions from my September 11, 2026 analysis (GitHub repo). On July 9, facilities those companies run held 57.8% of ICE's reported population. Of that, 50.5% was in the three IGSA types and 42.9% was in contract detention facilities.
Facility-Name Search
What I searched. I searched the description of every award record in ICE’s two accounts for the name of each facility in ICE's detention statistics. The facilities are the 271 that appear in at least one ICE statistics release from January 21, 2025 through July 9, 2026. The facility list is on this analysis’ GitHub repo.
How facilities were grouped. I grouped facilities by the types ICE reported during that period:
Federal or contract facilities (49): federal prisons, ICE processing centers, contract detention facilities, Marshals Service contract facilities, Defense Department sites and staging facilities.
IGSA facilities (224): the three IGSA types above.
Five facilities carried labels from both groups at different times, including T. Don Hutto, Florence and Robert A. Deyton. They count in each group. Three facilities labeled only as state or juvenile facilities are in neither.
What counted as a match. A match required a facility's complete name, after standardizing capitalization and punctuation, and could not match another facility's name. I also used 15 reviewed partial names, such as "T Don Hutto." I excluded eight names that appear inside other facilities’ names, and two awards whose descriptions name a place rather than the facility.
Results. Dollar totals add each matched award's object class 25.4 obligations for the period once, even if its description names more than one facility.
Federal or contract group: 21 facilities named in 76 awards, with $2,229,581,023, or 71% of $3.14 billion.
IGSA group: 5 facilities named in 12 awards, with $96,196,138.33, or 3%. Of that, $78,730,777 went to the three facilities ICE also listed under a federal or contract type.
Facilities listed solely under an IGSA type: two awards, both task orders under CoreCivic's direct contract for Torrance and Cibola counties, with $17,465,361.06.
Limits. A facility counts in a group if ICE listed it under that type at any point in the period, not necessarily when the award was made. Award descriptions need not name a facility, so the search can miss payments. A name match does not show which agreement a payment was made under.
Torrance and Cibola Counties
Where to find the agreements. ICE posts detention agreements and modifications in its FOIA Library. I used:
Torrance County's agreement 70CDCR19DIG000009, dated May 15, 2019, and modification P00045.
Cibola County's agreement EROIGSA-17-0003, dated October 28, 2016, see modifications P00029, P00024 and P00025–P00026.
The Cibola documents are scanned images. I read them with optical character recognition and confirmed the agreement date, the county's UEI and the task order number by eye.
What I searched. I searched all records in both File C downloads, across every Homeland Security account, for:
both agreement numbers;
the task orders the modifications name for payments: 70CDCR25FIGR00147 (Torrance) and 70CDCR25FIGR00001 (Cibola);
both counties' UEIs: Q8N2MFFYFMC4 and VLKVAHDJ4MW8;
any recipient or place of performance in either county.
The comparison ignored punctuation and treated the letter O and the digit 0 as the same. No record carried any of the identifiers. Apart from CoreCivic's two task orders, the records located in either county are unrelated, such as FEMA and flood-insurance payments. USAspending.gov's award and transaction search, queried September 26–27, 2026, also returned no record of either IGSA task order.
The direct contract. Search USAspending.gov for contract 70CDCR26D00000029 to see CoreCivic's award and its three task orders. They carry $17,465,361.06 in object class 25.4 through July 2026: $9,023,550.00 for Torrance and $8,441,811.06 for Cibola. They also carry $708,458.18 for transportation. As of September 27, 2026, their award pages show $22,869,719.24 in total obligations, including $4,695,900 obligated in August 2026. ICE's advance notice of the sole-source award is on SAM.gov as notice NOI-70CDCR26R00000014.
File B Obligations Linked to Spending Awards, by Object Class
The final chart covers the operations account (0540) only. For four object classes, it compares File B and File C obligations from February 2025 through July 2026:
operation and maintenance of facilities (25.4);
equipment (31.0);
travel and transportation of persons (21.0);
other services from non-federal sources (25.2).
The untied amount is the difference between each object class’s File B obligations and File C obligations. Together, the four classes have $4.8 billion not tied to any award. That amount may include payments under IGSAs. It also includes other spending, such as travel by ICE employees, agency-wide equipment and payments to other federal agencies. It is not an estimate of IGSA spending.
Footnotes
Federal Funding Accountability and Transparency Act of 2006, § 2(a)(4), 31 U.S.C. 6101 note, (https://uscode.house.gov/view.xhtml?req=granuleid:USC-prelim-title31-section6101&num=0&edition=prelim). The definition excludes individual transactions below $25,000.↩︎
U.S. Department of Homeland Security, Office of Inspector General, ICE's Immigration and Customs
Enforcement Did Not Follow Federal Procurement Guidelines When Contracting for Detention Services, (February 2018) (https://www.oig.dhs.gov/sites/default/files/assets/2018-02/OIG-18-53-Feb18.pdf).↩︎
Public Law 104-208, Division C §373 (September 30, 1996) (https://www.govinfo.gov/content/pkg/PLAW-104publ208/pdf/PLAW-104publ208.pdf).↩︎
U.S. Department of Homeland Security, Office of Inspector General, ICE's Immigration and Customs
Enforcement Did Not Follow Federal Procurement Guidelines When Contracting for Detention Services, (February 2018) (https://www.oig.dhs.gov/sites/default/files/assets/2018-02/OIG-18-53-Feb18.pdf).↩︎
Ibid. ICE developed new guidance for IGSAs in 2019, which the GAO cited in a 2021 report, but I could not find a public copy of that guidance. See U.S. Government Accountability Office, Immigration Detention: Actions Needed to Improve Planning, Documentation, and Oversight of Detention Facility Contracts (January 2021) (https://www.gao.gov/assets/gao-21-149.pdf).↩︎
U.S. Immigration and Customs Enforcement, FY2026 detention statistics (July 20, 2026 release), "Facilities FY26" tab (https://www.ice.gov/doclib/detention/FY26_detentionStats07202026.xlsx). Average daily population is the sum of each facility's fiscal-year-to-date average (Levels A–D).↩︎
USAspending.gov publishes agencies' spending reports in several files. File A reports balances by appropriations account. File B breaks the same obligations down by program activity and object class, the categories defined in OMB Circular A-11, section 83. File C reports obligations for individual awards. This post compares File B and File C for the same accounts, object class and reporting periods.↩︎
The 10 contractors and their award-linked obligations are GEO Group ($1.01 billion), Acquisition Logistics ($598 million), CoreCivic ($460 million), Amentum Services ($453 million), Akima Infrastructure Protection ($281 million), Paragon Professional Services ($99 million), Akima Global Services ($91 million), Management & Training Corporation ($60 million), KVG LLC ($19 million), and GardaWorld Federal Services ($8 million). Each has at least one award that federal records tie to ICE detention, custody, or detainee transportation. The two Akima companies are counted separately because the award records do not show them sharing a parent. Two other detention contractors, LaSalle Corrections and Asset Protection & Security Services, each received a $250 minimum order and are not counted.↩︎
The award records also list the Denver Health and Hospital Authority, which USAspending.gov categorizes as both a local government and a hospital. I grouped it with public hospitals, universities, and nonprofits rather than with state and local governments, because it is a public health care provider rather than a general-purpose government. Its only award record in this period is a $2,000 reduction to an earlier award (70CDCR23P00000029). Counting it as a local government would bring the total to three local government entities with a net reduction of $30,520.↩︎
USAspending.gov notes that “maintaining data quality for the award description field has been persistently challenging for federal agencies,” and that some descriptions “lack meaningful information altogether.” USAspending.gov, About the Data, p. 12, https://www.usaspending.gov/data/about-the-data-download.pdf (accessed September 27, 2026).↩︎
U.S. Immigration and Customs Enforcement, Agreement EROIGSA-17-0003 (dated October 28, 2016) (https://www.ice.gov/doclib/foia/detFacContracts/EROIGSA-17-0003-P00029.pdf) (Cibola county); Agreement 70CDCR19DIG000009, (dated May 15, 2019) (https://www.ice.gov/doclib/foia/detFacContracts/70CDCR19DIG000009-P00045_TorranceCoIGSA_EstanciaNM.pdf).↩︎
Author's search of the Department of Homeland Security's File C downloads from USAspending.gov (FY2025 periods 1–12, retrieved September 16, 2026; FY2026 periods 1–10, retrieved September 15, 2026), across all accounts and award types. The search looked for both agreement numbers (70CDCR19DIG000009 and EROIGSA-17-0003), the task orders ICE's modifications name for payments under them (70CDCR25FIGR00147 for Torrance and 70CDCR25FIGR00001 for Cibola), both counties' Unique Entity Identifiers (Q8N2MFFYFMC4 and VLKVAHDJ4MW8), and recipients or places of performance in either county.↩︎
Immigrant Safety Act, H.B. 9, 2026 N.M. Laws ch. 5, § 3, (https://www.nmlegis.gov/Sessions/26%20Regular/final/HB0009.pdf).↩︎
U.S. Immigration and Customs Enforcement, “Notice of Intent to Sole Source – Torrance and Cibola,” SAM.gov, NOI-70CDCR26R00000014, March 10, 2026, https://sam.gov/opp/ee796eb2d09b4216a30f6b15d9dd4a8d/view.↩︎
The contract is USAspending.gov award 70CDCR26D00000029 to CoreCivic, signed April 30, 2026, for “detention and transportation support services at the Torrance and Cibola detention facilities,” see: https://www.usaspending.gov/award/CONT_IDV_70CDCR26D00000029_7012.↩︎
Object class 21.0 covers travel by federal employees as well as transportation of detainees. OMB Circular A-11, section 83, defines object class 25.4 as operation and maintenance of facilities "when done by contract with the private sector or another Federal Government account," https://www.whitehouse.gov/wp-content/uploads/2025/08/a11.pdf.↩︎
DHS Office of Inspector General, Immigration and Custom Enforcement Detention Bedspace Management (April 2009) (https://www.oig.dhs.gov/sites/default/files/assets/Mgmt/OIG_09-52_Apr09.pdf);
DHS Office of Inspector General, Immigration and Customs Enforcement Did Not Follow Federal Procurement Guidelines When Contracting for Detention Services, (February 21, 2018), (https://www.oig.dhs.gov/sites/default/files/assets/2018-02/OIG-18-53-Feb18.pdf); DHS Office of Inspector General, ICE Does Not Fully Use Contracting Tools to Hold Detention Facility Contractors Accountable for Failing to Meet Performance Standards, OIG-19-18 (January 29, 2019), https://www.oig.dhs.gov/sites/default/files/assets/2019-02/OIG-19-18-Jan19.pdf; U.S. GAO, Immigration Detention: Actions Needed to Improve Planning, Documentation, and Oversight of Detention Facility Contracts (January 2021), (https://www.gao.gov/assets/gao-21-149.pdf).↩︎
DHS Office of Inspector General, Immigration and Customs Enforcement Did Not Follow Federal Procurement Guidelines When Contracting for Detention Services, Appendix C (February 21, 2018), (https://www.oig.dhs.gov/sites/default/files/assets/2018-02/OIG-18-53-Feb18.pdf).↩︎
Daily Iowan, Muscatine County Jail Releases ICE Contract, (March 4, 2026) (https://dailyiowan.com/2026/03/04/muscatine-county-jail-releases-ice-contract/) and Iowa Capital Dispatch, ICE contract with Iowa jail increased funding for detentions by 75% (March 6, 2026) (https://iowacapitaldispatch.com/2026/03/06/ice-contract-with-iowa-jail-increased-funding-for-detentions-by-75/).↩︎
Sioux City Journal via Corrections1, Iowa jail projects $2.3M increase from ICE detainees (February 9, 2026) (https://www.corrections1.com/iowa-jail-projects-2-3m-increase-from-ice-detainees).↩︎
Analysis by Greg Constantine, published at https://www.readfrontier.org/31564-2/.↩︎