CBO’s Iran War Estimate and the Importance of Assumptions
On September 15, the Congressional Budget Office estimated that the conflict with Iran had cost the Department of Defense approximately $38 billion through August 1, 2026. CBO also projected that the conflict’s economic consequences would have “modest” and “roughly offsetting” effects on federal revenues and spending.
But that conclusion rests on the assumption that the additional inflation and interest-rate pressure caused by the war fades in 2027, which may not happen. Recent Houthi militia attacks have closed a critical Saudi Arabian oil pipeline. U.S. diesel prices have reached $6.29 a gallon, and rising fuel costs and shortages have triggered disruptions and protests around the world. What would more persistent inflation and higher interest rates from the Iran war mean for the federal budget?
CBO’s interactive calculator allows you to explore that question. In the analysis below, I used it to quickly estimate the budgetary impacts of more persistent inflation and higher interest rates.
Why CBO Found Small Budgetary Impacts
Higher inflation pushes the federal budget in opposite directions. It raises nominal incomes and tax revenues, but also increases entitlement spending because many benefits are indexed to inflation. Higher wages and prices also increase discretionary spending, and higher interest rates increase federal borrowing costs. The net effect on the federal deficit depends on how these changes balance over time.
In its September 15 estimate, CBO explained that the Iran war affects inflation primarily through higher energy costs. It estimated that the war added 2.3 percentage points to the annualized rate of personal consumption expenditures (PCE) inflation in the second quarter of 2026, when total PCE inflation was 5.3 percent. By the first quarter of 2027, CBO projects year-over-year PCE inflation would be 0.5 percentage points above its February forecast, and core PCE, which excludes food and energy, would remain 0.3 percentage points higher. CBO also estimated that 3-month Treasury bill rates were “nearly” 0.2 percentage points above its baseline projections in 2026, and that the difference would fall below 0.1 percentage points “by the first half of 2027.”
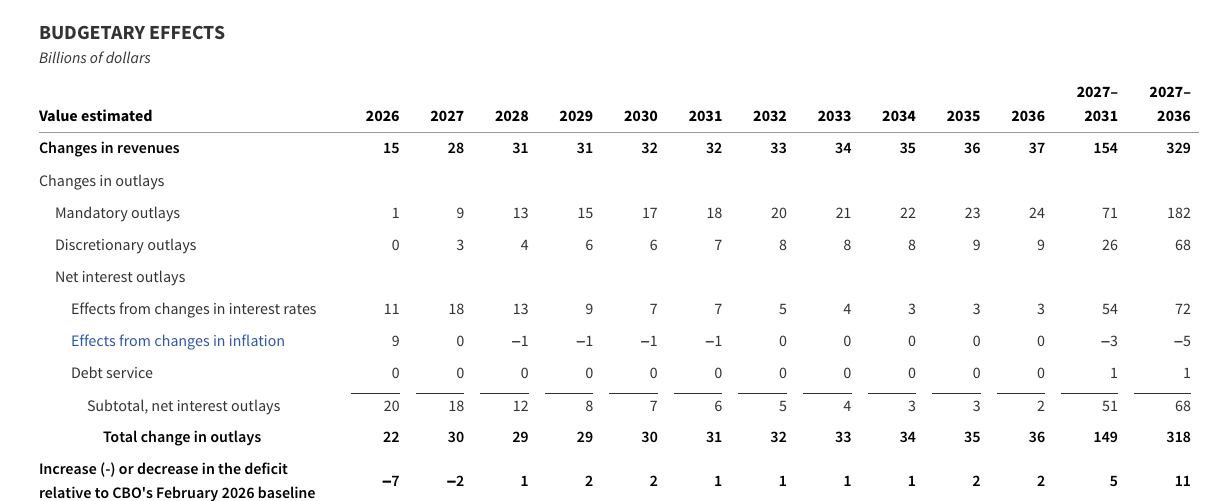
To approximate this, I translated these estimates from the letter into CBO’s interactive calculator, which required making a few assumptions to annualize CBO’s point estimates. For inflation, I assumed that the price increase associated with CBO’s second-quarter inflation surge persisted through the rest of 2026 and then cross-walked that increase to its GDP projections (available on CBO’s GitHub page). That translates to annual inflation of about 0.43 percentage points above CBO’s baseline. For interest rates, I entered a 0.2 percentage point increase in 2026 and a 0.05 percentage point increase in 2027.
The calculator is not as precise as CBO’s cost estimate. Its inflation input affects CBO’s GDP price index and other wage and price indexes, and the interest-rate input is the 10-year Treasury rate and affects rates across maturities. But these are reasonable proxies, and they produce a cumulative $11 billion reduction in deficits over fiscal years 2027–2036. To be clear: this is not CBO’s estimate, but it does show how these effects can offset each other.
Figure 1 - Ballpark Approximation of CBO’s Current Estimate
What If Current Trends Continue Through the Rest of the Trump Administration?
Next, I estimated a scenario that uses CBO’s inflation and interest rate estimates for 2026 and then assumes that today’s inflation and Treasury rates persist through the end of the Trump Administration and immediately revert to CBO’s baseline on January 20, 2029. To do this, I used the 3.3 percent year-over-year core PCE inflation rate for July, reported by the Bureau of Economic Analysis, and the 5 percent yield on 10-year Treasury securities.
The Iran war is not solely responsible for these levels. They also reflect the buildout of artificial intelligence infrastructure — which is the largest investment boom of my lifetime — and other disruptions caused by the Ukraine-Russia war and the Trump Administration’s tariff policy.
When I worked at CBO, we often had to complete estimates that depended on assumptions with significant uncertainty. In these situations, we typically started with a 50/50 assumption to acknowledge that we lacked a basis for a more informed judgment and refined the percentage as we gained more information and became more confident in our predictions.
Under a 50/50 assumption, the model produces cumulative deficit increases of:
- $213 billion over fiscal years 2026–2029, with $110 billion due to the Iran war; and
- $356 billion over fiscal years 2027–2036, with $178 billion due to the war.
Figure 2 - Estimate of Elevated Inflation and Interest Rates Through the End of Trump Administration
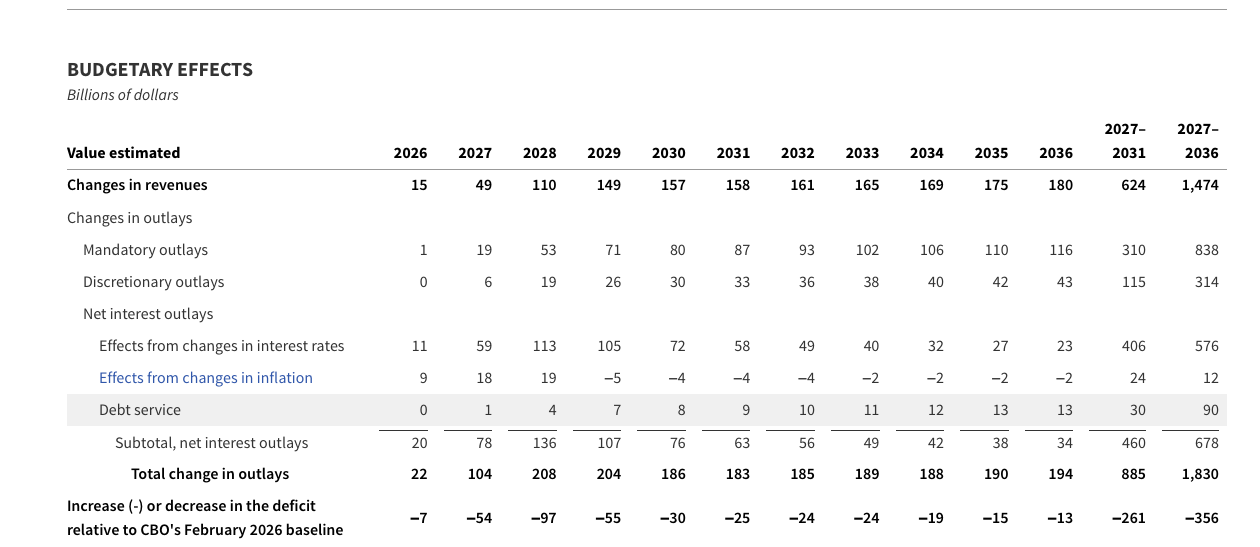
Note: Because the assumed conditions end on January 20, the 2029 inputs are prorated to 0.07 percentage points for inflation and 0.04 percentage points for interest rates. In addition, CBO’s calculator doesn’t allow for changes greater than ±1 percentage point, which caps the inflation increase in 2028.
What If Current Trends Continue for the Next Decade?
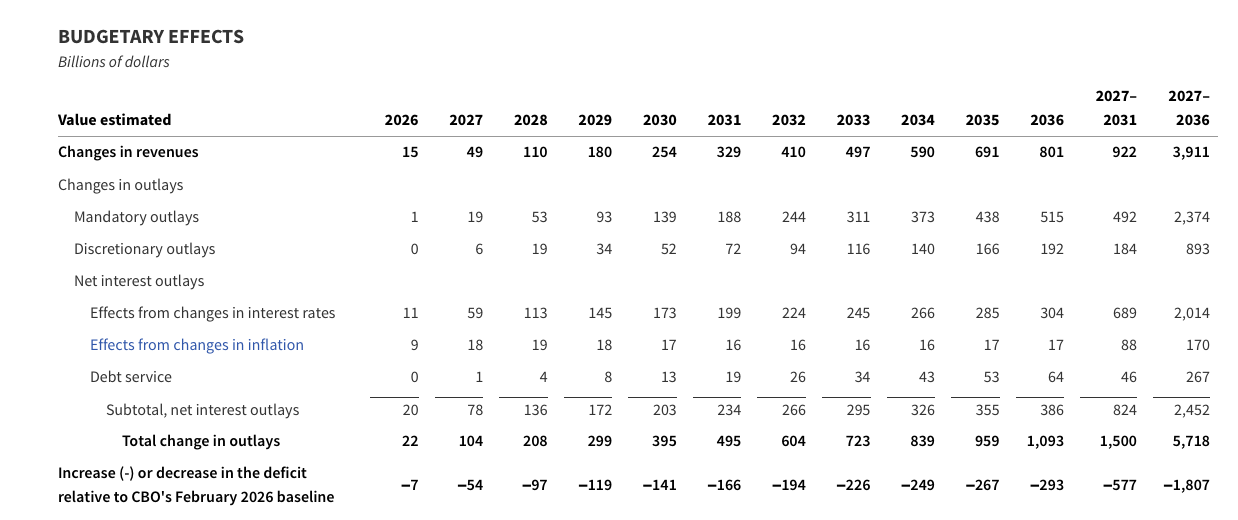
The final scenario extends the second scenario through the end of CBO’s “budget window” in 2036. The interest-rate inputs keep the displayed 10-year Treasury rate near 5.0 percent. The inflation inputs reach the calculator’s maximum of 1 percentage point beginning in 2028.
Under those capped inputs, cumulative deficits increase by approximately $1.8 trillion over fiscal years 2027–2036. Applying the same 50 percent attribution assumption assigns approximately $900 billion of that effect to the Iran war and the other $900 billion to all other factors.
Figure 3 - Estimate of Elevated Inflation and Interest Rates Through 2036
What These Scenarios Show
CBO’s $38 billion cost estimate generated immediate headlines and provided Congress with information it had been seeking for months. The scenarios above are not alternative cost estimates. But they show how CBO’s separate estimate of the war’s macroeconomic effects depends on the assumption that the war’s effect on inflation and interest rates will fade quickly in 2027. If they do not, the full budgetary and economic consequences could be much larger.
That is not a criticism of CBO. To produce any cost estimate, the agency had to assume a length for the war, which even experienced commodity traders on Wall Street are now calling impossible.
CBO deserves immense credit for making this kind of analysis possible by publishing tools like the rules-of-thumb calculator and by documenting its forecasts in such detail. If you haven’t already, I recommend spending time with the agency’s data page and GitHub repo.
I also hope this analysis shows how you can use that material to ask and answer your own budgetary questions that go beyond the headlines’ summary of CBO’s analysis.
Methodology and Limitations
I entered the scenario assumptions into CBO’s combined inflation-and-interest-rate rules-of-thumb website. This tool applies the inflation input to the GDP price index and other wage and price indexes and applies its interest-rate change across maturities, even though the displayed result is the 10-year Treasury rate.
I applied the 50/50 assumption in years 2027-2036, as applicable, after the model calculates the total deficit effect. I did not halve the economic inputs and rerun the workbook.
The model cannot reproduce every feature of the observed economy. The 3.3 percent core PCE reference is not the same measure as GDP-price-index inflation, and one interest-rate input cannot simultaneously hold both short- and long-term rates at their observed levels. The calculations preserve those mismatches rather than treating the scenarios as forecasts.
The annual inputs and year-by-year workbook outputs are documented with the project’s calculation record. Readers can test alternative assumptions using CBO’s interactive tool, and the underlying formulas are available in CBO’s official workbook.